Gigaom New Relic wordpress plugin resources analysis
| Download This Plugin | |
| Download Elegant Themes | |
| Name | Gigaom New Relic |
| Version | 0.3 |
| Author | Gigaom |
| Rating | 100 |
| Last updated | 2014-11-04 02:34:00 |
| Downloads |
2196
|
| Download Plugins Speed Test plugin for Wordpress | |
Home page
Delta: 0%
Post page
Delta: 0%
Home page PageSpeed score has been degraded by 0%, while Post page PageSpeed score has been degraded by 0%
Gigaom New Relic plugin added 11 bytes of resources to the Home page and 22 bytes of resources to the sample Post page.
Gigaom New Relic plugin added 0 new host(s) to the Home page and 0 new host(s) to the sample Post page.
Great! Gigaom New Relic plugin ads no tables to your Wordpress blog database.Supports both New Relic APM and Browser monitoring to give a clear picture of how your site performs both on the server and in the browser.
Application Performance Monitoring (APM)
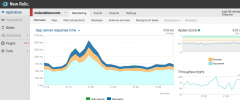
Automatically detects if the APM extensions are installed on the server. If so, the plugin will start reporting into the New Relic account associated with the license key used when installing the extension.
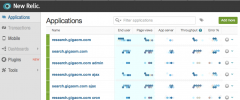
There's no UI, but the plugin automatically sets the app name and other configuration values ideally for each request. The app name is based on the blog's name. User-facing and dashboard activity are reported as separate apps so you can set different QoS and alert settings for each. Even cron and admin-ajax activity are separated out for individual tracking.
Each blog in a multi-site installation is tracked separately, using the name of the blog as the app name.
Browser monitoring (RUM)
Real user monitoring (browser monitoring) is automatically enabled if the APM extension is active, but in situations where the APM extension can't be used, the plugin can still be used to track browser performance.
This mode requires some configuration:
- Get the tracking JavaScript from New Relic.
- Go to your WordPress dashboard -> Settings -> New Relic Settings and paste in the JavaScript
- Go to the New Relic dashboard to see your site reporting performance data!
The plugin extracts the configuration details from the JS and inserts them with a clean copy of the JS on each page (this cannot be used to inject arbitrary JS into the page).
Due to limitations of the Browser monitoring service/API, Browser-only monitoring does not include all the data or separate reporting of activity in separate apps as APM does.
In the WordPress.org plugin repo
Here: https://wordpress.org/plugins/go-newrelic/
Fork me!
This plugin is on Github: https://github.com/gigaOM/go-newrelic


